Thursday, March 15, 2012

Java 7:Top Features

Java 7 (codename Dolphin) is a major update to Java that was launched on July 7, 2011.

The Java 7 release initially included many JSRs with exciting features, like support for closures, which were later deferred to Java 8 in order to release JSRs that are already done.

Java Releases

Here’s a quick snapshot of the past Java release dates (table 1). There are several small new features and enhancements in Java 7. Out of the 28 features that I looked at, here are the ones that I found useful.


 New features and enhancements

#1 Strings in switch

In programming, we often encounter situations where we need to do different things based on different values of a variable. For Boolean variables, an if-then-else statement is the perfect way of branching code. For primitive variable types we use the switch statement. However, for String variables, we tend to resort to using multiple if-then-else branches as follows.

Java 6 and Before
One workaround for this is to convert the String into an enum and then switch on the enum.

Java 7

Java 7, however, has added a language level support for String in switch. Now you can rewrite the same code more elegantly:
 
 Not only does this help us write more readable code, but it also helps the compiler generate more efficient byte code as compared to the if-then-else by actually switching on the hashcode() and then doing an equals() comparison. Please note that you will get a NullPointerException if the variable language in the above example resolves to null. I like this feature, but unlike some of the other enhancements in the past (like Generic in Java 5), I don’t anticipate using this feature a lot. Practically, I find myself using if-then-else for one or two values and resort to an Enum when the number of values are higher.

#2 try-with-resources statement

One of the most useful additions in Java 7 is the auto closing of resources like InputStream which helps us reduce boiler plate code from our programs. Suppose we were writing a program which reads a file and closes the FileInputStream when it’s done, here is how you would write the program:

With Java 6 and Before

I want to point out a couple of things in this code. Firstly, notice that we declare the FileInputStream outside the try block just so that it can be accessed in the finally block. The second observation is that we need to initialize the InputStream to null, so that it is guaranteed to be initialized when we access it in the finally block. Last but not the least, the is.close() in the finally block may throw an Exception as well, thereby hiding the original Exception thrown in the try block Exception from the caller. What we probably want is to handle the Exception thrown from is.close() and throw the original IOException.
 

The above code still has a shortcoming that the Exception thrown from finally is supressed and not accessible to the calling code. I’m not sure how often we want to get both the original Exception and also the Exception thrown from the finally block, but if we did want it, we could do always do something like this:
 
SuppressedException above is a user written Java bean with a field named suppressed of type Exception. The calling code can then call SupressedException.getThreadLocal().getException() to get the Exception that was supressed in the finally clause. Great, we solved all the problems associated with the try-catch-finally! Now we must remember to repeat this exact sequence with each use of try-catch-finally when handling files or other resources which need to be closed. Enter Java 7, and we can do the above without the boiler plate code.

With Java 7

 
try can now have multiple statements in the parenthesis and each statement should create an object which implements the new java.lang.AutoClosable interface. The AutoClosable interface consists of just one method.

Each AutoClosable resource created in the try statement will be automatically closed! If an exception is thrown in the try block and another Exception is thrown while closing the resource, the first Exception is the one eventually thrown to the caller. The second Exception is available to the caller via the ex.getSupressed() method. Throwable.getSupressed() is a new method added on Throwable in Java 7 just for this purpose.

Mandatory catch block when using the try statement

Note that if you are creating AutoClosable resources in the try block, you are required to declare a catch block to catch the concrete exception thrown from the actual AutoClosable. close() method. Alternatively you need to throw the Exception. Think of the close() method as implicitly being called as the last line in the try block. So, if an application has its own AutoClosable class as follows:


Then, the following will cause a compile error:


To fix the above, you need to catch or throw the Exception from the calling method.


Syntax for declaring multiple resources

The try statement can contain multiple statements separated by semicolon. Each statement must result in an AutoClosable object.


It is illegal to declare any variable which isn’t an AutoClosable.

 Output

ERROR: try-with-resources not applicable to variable type
required: AutoCloseable
found: long

AutoClosable vs Closable

The old Closable interface introduced in Java 5, which also has the same method that now extends from AutoClosable, implying that all Closable classes are automatically Auto-Closable. Those classes automatically become resources that can be created in the try statement. The slight difference in AutoClosable and Closable is that unlike Closable.close(), AutoClosable.close() is not supposed to be idempotent, which means that calling it twice can have side effects. The second difference is that since exceptions thrown from AutoClosable. close() are suppressed, AutoClosable.close() should not throw exceptions which can cause problems when suppressed, like the InterruptedException.

#3 More precise rethrow

There are often situations when we want to catch multiple exceptions of different types, do “something” with them, and rethrow them. Let us consider this example, where we have some code which throws IOException and SQLException.


In the above example, we are logging each type of exception being thrown by the try block before rethrowing them. This results in a duplication of code in the catch blocks. Before Java 7, to get around the code duplication issue we would catch the base exception as follows:


However, this requires us to rethrow the base Exception type java.lang.Exception from the calling method.
public static void main(String[] args) throws Exception {

With Java 7

Java 7 has added the “precise rethrow” feature which lets you catch and throw the base exception while still throwing the precise exception from the calling method.

 
Note the keyword final in the above catch clause. When a parameter is declared final, the compiler statically knows to only throw those checked exceptions that were thrown by the try block and were not caught in any preceding catch blocks.

#4 Multi-catch

There is no elegant way with Java 6 to catch multiple exceptions of different types and handle them in the same way.

You can always catch the parent Exception in order to avoid duplication of code, but it is not always suitable especially if the parent is java.lang.Exception. Java 7 lets you catch multiple Exceptions in a single catch block by defining a “union” of Exceptions to be caught in the catch clause.


Note that the pipe ‘|’ character is used as the delimiter. The variable ‘ex’ in the above example is statically typed to the base class of Ex1 and Ex2, which is java.lang.Exception in this case.

#5 Binary integral literals

With Java 7, you can now create numerical literals using binary notation using the prefix “0b”

int n = 0b100000;
System.out.println("n = " + n);

Output

n = 32

#6 Underscores in numeric literals

With Java 7, you can include underscores in numeric literals to make them more readable. The underscore is only present in the representation of the literal in Java code, and will not show up when you print the value.

Without underscore

int tenMillion = 10000000;
System.out.println(“Amount is “ + tenMillion);

Output

10000000

With underscore

int tenMillionButMoreReadable = 10_000_000;
System.out.println("Amount is " + tenMillionButMoreReadable);

Output

10000000

More rules and examples

1. Consecutive underscores is legal.

int n = 1000______000;

2. Underscores can be included in other numeric types as well.

double d = 1000_000.0d;
long l = 1000_000l;
int hex = 0xdead_c0de;
int bytes = 0x1000_0000;

3. Underscore can be included after the decimal point.

double example8 = 1000_000.000_000d;

4. It is illegal to start a literal with an underscore


5. It is illegal to end a literal with an underscore.


6. It is also illegal to have underscore be just before or after a decimal point.


7. Improved type inference for generic instance creation

Java 5 introduced generics which enabled developers to write type safe collections. However, generics can sometimes be too verbose. Consider the following example where we are creating a Map of List of String.

With Java 5 and 6

Map<String, List<String>> retVal = new HashMap<String, List<String>>();

Note that the full type is specified twice and is therefore redundant. Unfortunately, this was a limitation of Java 5 and 6.

With Java 7

Java 7 tries to get rid of this redundancy by introducing a left to right type inference. You can now rewrite the same statement by using the <> construct.

Map<String, List<String>> retVal = new HashMap<>();

This does make the code a little less verbose. You can also use <> construct when returning a newly created object.


This, in my opinion, goes only half way. The full solution would have been a right to left full type inference.

Map map = new HashMap<String, String>();

The above would have made the code even less verbose. Though this enhancement can still be done in a later version.

#8 More new I/O APIs for the Java platform (NIO.2)

A new set of I/O APIs and features were introduced in Java 1.4 under the java.nio package. This addition was called the New I/O APIs, also known as NIO. Naming something New is always short-sighted because it will not remain new forever. When the next version comes along, what should the new version be called, the NEW NEW I/O? Java 1.7 offers a rich set of new features and I/O capabilities, called NIO.2 (New I/O version 2?). Here are the key highlights of NIO.2.

a) Package

The most important package to look for is java.nio.file. This package contains many practical file utilities, new file I/O related classes and interfaces.

b) The java.nio.file.Path interface

Path is probably the new class that developers will use most often. The file referred by the path does not need to exist. The file referred to does not need to exist. For all practical purposes, you can think of replacing java.io.File with java. io.Path.

Old Way

File file = new File("hello.txt");
System.out.println("File exists() == " + file.exists());

New Way

Path path = FileSystems.getDefault().getPath("hello.txt");
System.out.println("Path exists() == " + Files.exists(path));

c) The java.nio.file.Files class

The Files class offers over 50 utility methods for File related operations which many developers would have wanted to be a part of earlier Java releases. Here are some methods to give you a sense of the range of methods offered. • copy() – copy a file, with options like REPLACE_EXISTING, NOFOLLOW_LINKS public static Path copy(Path source, Path target, CopyOption... options);

move() – move or rename a file public static Path move(Path source, Path target, CopyOption... options);

newInputStream() – create input stream public static InputStream newInputStream(Path path, OpenOption... options);

readAllBytes() – similar to the Apache IOUtils.readFile-ToByteArray public static byte[] readAllBytes(Path path) throws IOException;

createSymbolicLink() – creates a symbolic link, if supported by the file system public static Path createSymbolicLink(Path link, Path target, FileAttribute<?>... attrs) throws IOException


d) WatchService API

WatchService API is a new feature introduced in Java 1.7. It provides an API that lets you “listen” to a certain type of file system events. Your code gets called automatically when those events occur. Examples of event types are captured by StandardWatchEventKinds class.

• ENTRY_CREATE:an entry is created or renamed in the directory
• ENTRY_DELETE:an entry is created or renamed out of the directory
• ENTRY_MODIFY:a directory entry is modified

Example
Here’s a full example of how to watch a directory and print any newly created files.


Run the above program. Then create a file ‘new.txt’ in the directory ‘logs’. The program will print:
logs: new file created new.txt


Links:

Friday, March 2, 2012

Performance monitoring tools optimize Java applications

Sun’s JConsole monitoring tool is included with the Java Developers Kit 5.0. It leverages the Java virtual machine’s comprehensive instrumentation to deliver real-time information on resource utilization and consumption and total application performance. JConsole accesses core functionality for monitoring and managing the Java platform including:
  • Memory status – detection of low memory
  • Manages verbose tracing of GC and class loading (enable/disable)
  • Detection of programming deadlocks
  • Control of any loggers running in the application
  • Access Sun's platform extension to manage operating system resources
  • Manage Java Beans  
VisualVM runs on Oracle and Sun JDK 6 to monitor Java applications and troubleshoot performance issues. It utilizes available Java technologies, including jvmstat, Serviceability Agent (SA), and JMX, to automatically gather data using the most efficient method possible so that the least amount of system overhead is imposed on the application. Its default features meet the needs of system developers and administrators, and enables application users to submit comprehensive bug reports. The tool is useful for production and development phases and expands the Java platform’s capability to monitor and analyze performance.
Hewlett Packards’ HPjconfig is a tool for configuring Java kernel parameters to meet your application’s requirements when under HP-UX 11i on the HP 9000 PA-RISC system and other compatible systems. HPjconfig recommends kernel parameters and provides save and restore functions to enable distribution of those recommendations to application users. Informed of the exact Java and HP-UX versions to be analyzed, HPjconfig will confirm that the latest patches are installed to ensure maximum performance. Any missing or superseded patches are highlighted for easy identification and resolution.

HeapAnalyzer from IBM detects Java heap leaks using heuristic search analysis of the heap dump in the application. HeapAnalyzer parses the Java heap dump to produce directional graphs then transforms those into directional trees.
An open source tool, GCViewer, lets developers visualize data from verbose garbage collection on Sun and IBM virtual Java machines. You can maximize the performance of your garbage collector using metrics provided by GCViewers, including throughput, longest pause, accumulated pauses and others. Better garbage collection will increase application performance as well.

Java Out-of-Box Tool installs startup scripts that configure system tuning parameters to deliver better “out-of-box” performance. Upon installation, the software modifies kernel parameters, rebuilds the kernel, and then executes a system reboot.

Practical challenges of profiler integration with Java/J2EE applications

Profiling is a technique used to identify code-level performance bottlenecks in an application and tune application code accordingly. In the context of Web-based and multi-tiered applications, the profiling needs to be done in the Application Server/Middleware tier as most of the business logic processing is centered there. The focus of this paper is to briefly describe the components and process of profiling; share some practical challenges of integrating profiling tools with Java applications specifically; and suggest some options to overcome these issues so that profiling and tuning activities can be carried out effectively. 
Introduction
The term “Profiling” refers to understanding and analyzing an application's programs in terms of the time spent in various methods, calls and/or sub-routines and the memory usage of the code. This technique is used to find the expensive methods/calls/subroutines of a given application program and tweak them for performance optimization and tuning. Alternately, the amount of time it takes the code to run is also referred to as “Latency.” In typical multi-tiered applications; especially on the server side, it is called “Server-Side Latency”.
Profiling can also be used to get insights on the application in terms of memory usage -- such as how the objects/variables are created in memory provided by the runtime (JVM Heap, .NET CLR, Native Memory, or others) -- which can be further used to optimize the memory footprint of the applications. Also, for multi threaded applications, profiling can uncover issues related to Thread Synchronization and show the thread status as well.
The objective of this article is to enumerate some of the most common practical challenges in integrating Profiling Tools with Java/J2EE Applications (standalone or Application Server-based) and discuss workarounds that can help significantly reduce turnaround time required for profiling integration activity in the Application Performance Management process.
For instance, in a 3-tiered Web application comprised of a WebServer, Application Server and a Database server, let us consider an online business use case or business transaction that is taking more time to respond to an end user who is accessing it through a browser. In this context, the high end-to-end response time of the transaction could be attributed to Client Side Rendering, Web Server Request/Response handling, or Business Logic Processing on the Application Server or Query Execution on the Database Server. In order to find out the tier where the latency is high, profiling can be used to uncover where the server-side time is being spent.
types of profiling
Profiling can be broadly categorized into 2 types - CPU profiling and Memory Profiling.
CPU Profiling
CPU Profiling mainly focuses on identifying the high latency methods of the application code in Java context – it will provide the call graph for a given business process with the break-up of time spent in each of the methods. The method latency can be measured in 2 ways – Elapsed Time and CPU Time.
Elapsed Time is the time taken by a method. This includes the time taken within the method, its sub-methods and any time spent in Network I/O or Disk I/O. Ideally, the elapsed time is the duration between the entry and the exit of a method as measured by a wall clock. For instance, if a method involves the execution of business logic in Java code and SQL calls to a database (which is Network I/O), elapsed time shows the total time for all of that method to run.
Elapsed Time = CPU Time + DISK I/O + Network I/O 
CPU Time refers to the time taken by a method/function/routine spent exclusively on the CPU in executing the logic. Hence, it does not include the time taken for any I/O or any other delays from the Network or Disk I/O. For the same example mentioned above, CPU time does not show the time spent in database execution because that is Network I/O.
CPU Time = Time exclusively spent on CPU
(without I/O or any Interrupts Delay)
In general, it is the Elapsed Time which will be of interest; however, both halves provide quite valuable information about the application processing.
If the CPU time is very high for a given method/routine/function, it indicates that the method/routine/function is processing intensive and little I/O is involved for that method/routine/function.
Alternately, if the Elapsed Time is very high and CPU Time is less for a given method/routine/function , it indicates that the method/routine/function has significant I/O activity.
In extreme cases, the CPU time and the wall clock time can differ by a very large factor, especially if the executing thread has a low priority – since OS can interrupt the method execution multiple times due to low thread priority.
Memory profiling
Memory profiling refers to analyzing how the objects are created in memory provided by runtime (such as JVM for Java/J2EE applications and .NET CLR for .NET applications) and thereby to optimize the memory footprint needed for the applications. Memory profiling can also be used to find critical issues such as Memory Leaks in the applications.
generic architecture of profilers
This section provides a generic architecture of a Profiling Tool. Typically, any profiling tool will have 2 major components – an Agent and a Console.
An Agent is also sometimes called a Probe or Profiler which is a component that will run on a server (typically an Application Server) where the code is deployed and running. The agent will be attached with the JVM whichcollects performance metrics using JVMPI/JVMTI interfaces and push the data to a pre-configured port on the host machine where the application is running.
A Console is a Java program which typically captures data from the pre-configured port and displays the metrics in dashboard view. This will be used to view the metrics and also capture Snapshots that can be used for offline analysis. The diagram below illustrates the profiler’s architecture in general.

https://lh3.googleusercontent.com/-nRHVsjjWDFI/TqbR1UzH1OI/AAAAAAAAAE8/7Z7-L_BM1zw/s400/profiling01.jpg
Figure. 1. Generic Architecture & Componets of Java Profilers
Process steps in profiling
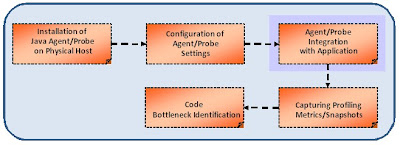
In the context of Java Profilers that need to be used with Java Application Servers/Java Standalone Programs, the Java Agent needs to be attached with the JVM so it can profile the application. This process is referred to as “Agent Integration” or “Profiler Integration”. This will be done by adding specific arguments to JVM in the Application Server’s startup scripts when invoking the standalone Java program.
https://lh6.googleusercontent.com/-bz1ME3Nm31Y/TqbR1kqVFdI/AAAAAAAAAFA/5pECSUSvbH0/s400/profiling02.jpg
Figure. 2. Process Steps in Profiling Activity
The sections below are focused towards Profiling Applications running in Java based Application Servers.
practical challenges in profilers integration & remediation
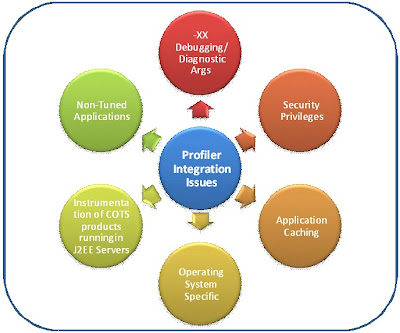
In this section, I would like to present the practical challenges of integrating Java Profiling Agents with Java/J2EE Applications and Java Application Servers and suggest ways and means to overcome the issue so that profiling activity can be carried out effectively. These issues are broadly divided into several categories as illustrated in Fig.3. below. The various categories and remedies are discussed in detail in the coming sections.
https://lh4.googleusercontent.com/-MGr27MDDozk/TqbR1tc7W5I/AAAAAAAAAFM/Fb_WbANo9M4/s400/profiling03.jpg
Figure. 3. Profiling Integration Issues

–XX Debugging/diagnostic Java parameters
Issue
Integration of Java profilers with Java based Application Servers might not be stable or successful if the JVM arguments contain the –XX arguments, especially some of the “Debugging” or “Diagnostic” flags. It should be understood that JVM options that are specified with -XX are not stable and are not recommended for casual use. Also, these options are subject to change without notice.
Hence, an attempt is made here to list some specific –XX flags to look out for while integrating Profilers with Java Application Servers if any unexpected behavior is observed with Profiler Agents.

Recommended Solution
JVM –XX Flag
Description
Impact
Suggestion
-XX:+AggressiveOpts
This flag turns on “point performance optimizations” that are expected to be ON by default in SUN JDK releases 1.5 and above. This flag is to try the JVM's latest performance tweaks, however a word of caution is that this option is experimental and the specific optimizations enabled by this option can change from release to release which should be evaluated prior to deploying the application to Production.
(NOTE: this should be used with -XX:+UnlockDiagnosticVMOptions & -XX:-EliminteZeroing)
JVM might not start up with a Java Agent / Probe
AND/OR
Application might crash


Disable these options
OR
Remove these switches from JVM Arguments list in order to enable the profiling activity
-XX:-EliminateZeroing
This option disables the initialization of newly created character array objects. Typically this will be used along with -XX:+UnlockDiagnosticVMOptions
If -XX:+AggressiveOpts is to be used
JVM might not start up with a Java Agent / Probe
AND/OR
Application might crash
-XX:+UnlockDiagnosticVMOptions

Any “diagnostic” flag of JVM/Java must be preceded by this flag.
JVM might not start up with a Java Agent / Probe
AND/OR
Application might crash
-XX:-ExtendedDTraceProbes
Enables performance-impacting “dtrace” probes – the probes that can be used to monitor JVM internal state and activities as well as the Java application that is running (Introduced in JDK 1.6. and Relevant to Solaris OS 10 above only)
If this option is already enabled, adding another Profiling Agent will make the JVM behavior unknown.

-Xrunhprof[:options] 
HPROF is actually a JVM native agent library which is dynamically loaded through a command line option, at JVM startup if the switch is passed to JVM arguments, and becomes part of the JVM process. By supplying HPROF options at startup, users can request various types of heap and/or cpu profiling features from HPROF.
If this option is already enabled, adding another Profiling Agent will make the JVM behavior unknown.

Non-tuned application
Issue
In certain scenarios, where the Application is not performance tuned or the business scenarios have high response time, attaching a profiler to some Applications (Application Servers) will cause time-outs and the Application Server sometimes could not even startup. This is attributed to the additional overhead profiling tools create due to byte-code instrumentation and the overhead linearly increases with the methods’ execution time causing the overall business scenario execution time to be even higher, resulting in time-outs.
Recommended Solution
The recommendation suggested for such scenarios is to identify the high latency code components “by introducing Java code in the application in order to capture the time taken in the crucial methods”. However, this approach has the disadvantage of choosing the critical/crucial classes and methods involved in a business transaction and instrument the logging statements which needs code change, code deployment. 
The following is a code snippet that illustrates this concept:


Class A {
                private long startTime, endTime;
                public Obj obj1;
                public Obj obj2;
                void public method1(){
                                startTime = System.currentTimemillis();
                                ……….
                                ………..
                                ………
                                endTime = System.currentTimemillis();
<logUtility>.log(“Time Spent in method” + this.getClass().getcurrentMethod()+ “in msec:” + (endTime-startTime); 
//assuming the log utility being used for this as well
}

Security privileges
This section highlights the typical security or access privileges issues encountered while integrating Java profiler agents with Java Applications. The table below lists the issues and recommendations to overcome them.

Issue
Issue Description
Suggestion
Owner permissions for Agent Installation Folder
If the Agent/Probe installation folder is not owned by the user with which the Java process gets executed/started, the Probe/Agent libraries cannot be loaded by the Java Process due to insufficient security privileges.

The agent installation folder on the file system should have “owner permissions” similar to that of the “Java Process” recursively
For instance, if the Java process gets started by “wasadmin” user group, the agent installation folder and all its sub-directories/folder should have “wasdamin” as the owner.

(NOTE: On UNIX based platforms, Primary UserId and Primary Group should be the same as that of the Java process)

E.g.:
chown –R <uid:Primary Group> <Agent Installation Folder> - UNIX based Platforms
Execute Permissions for Agent Installation Folder
If the Agent Folder just has only Read and Write permissions, the Agent/probe libraries cannot be executed within Java process.
Assign proper access permissions to the Probe Installation folder recursively

E.g.: chmod 775 <Probe Installation Directory> - (UNIX/LINUX/SOLARIS/AIX/HP-UX platforms)
Read/Write/Execute permissions - WINDOWS platform
Java Applications /Application Servers enabled with Java Security 
For  Java Applications that are enabled with Java Security, profilers might not start due to missing directives in server.policy file.

Grant all security permissions to Agent/Probe’s jar file by adding the  following directives to server.policy file as below.
E.g.: When integrating HP Diagnostics Java Probe with WAS 6.1, profiler could not start and get all the required metrics. The following is added to server.policy file:
grant codeBase "file:/opt/MercuryDiagnostics/JavaAgent/DiagnosticsAgent/lib/../lib/probe.jar" { permission java.security.AllPermission; };

(NOTE: For Java Security enabled standalone applications, identify the property file in which the required security directive needs to be added)

Application Caching
Issue
For certain applications, where Caching is used (either Custom Caching or Distributed Cache Products) to improve application’s performance, profilers might not work as expected. This is attributed to the increased overhead of tracking and probing each and every object available in the Cache.
As some of the Profilers/Probes will have default instrumentation points for different layers like JSP/Servlet, EJB, DAO and standard Java Frameworks like Struts, Spring and ORM tools like Hibernate, even without adding any custom instrumentation points, the overhead will be very high if the Application under consideration uses huge object Caches.
Recommended Solution
In such scenarios, it is suggested to follow one of the options highlighted below:
Disable all the default instrumentation points that come along with Probe/Profiler and observe the application behavior in the context of Profiler.
Disable Caching only while profiling the application to find out any bottlenecks in the Java code and other layers such as the Database or external systems.
Alternately, Reduce the Cache Size so that impact of object tracking and probing can be reduced (this works in most cases since it is desirable to design any Cache that can be configurable in terms of its Size and Cache Invalidation Policies).

Default instrumentation of COTS products running in J2EE Servers
Issue
If the application that needs to be profiled has some COTS products that run in JVM process area, JVM might not startup when invoked with a profiling agent.
I would like to share my experience with one of the industry-leading Rules Engine product that is hosted in a WebSphere Application Server instance which could not be started successfully after integrating a java profiler. With the profiler, the application server used to crash showing an issue in Java CompilerThread in libjvm.so which is a JVM library. There is no sign of any error coming from Profiler’s libraries. Without the profiler, no JVM crash is observed at any time.
Recommended Solution
Ensure that the COTS product running in Java process does not have any probing or monitoring mechanism enabled by DEFAULT. If enabled, try to disable and run with the profiler.
Check if the COTS product is compatible with the profiler in use – Many a times, it’s quite difficult to get any documentation which can confirm the product’s compatibility with the Profiler. Hence, it is suggested to reach out to the tool vendor or COTS vendor to get required support.

operating system specific
Issue
In certain cases, the number of file descriptors set in UNIX based (especially on UNIX/SOLARIS/LINUX/HP-UX) Operating Systems will have impact on the profiling process.
Since profiling activity will load more libraries and binaries, application servers in the context of Probe/Profiler might not start up properly with less number of file descriptors
Recommended Solution
It is recommended to check current file descriptors limit (using ulimit –n) and increase the number of file descriptors allowed on the system higher. It should be noted that this is not a mandatory change required whenever profiler is to be used with an application, however, it acts as one of the checklist items in case of unexpected errors while working with profiler-attached applications.

Introducing Selenium IDE, an open source automation testing tool

Selenium, the popular open-source automation test tool for Web-based software, comes in different flavors. This tutorial series started by introducing Selenium Remote Control (Selenium RC). However using Selenium RC requires knowledge of special commands, understanding the elements of an HTML page, and a fair amount of programming. Wouldn't it be nice to be able to record your own actions and convert those to Selenium commands, or, better yet, to record commands, insert some assertions, and just run the script back as a test, without all that complex programming?
There is just such a tool. It's called Selenium IDE.
A simple script recorded with Selenium IDE
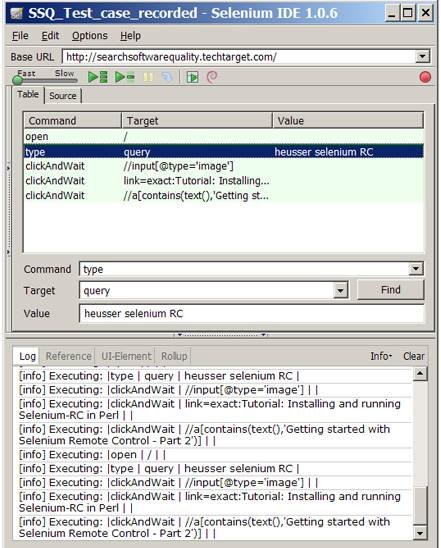
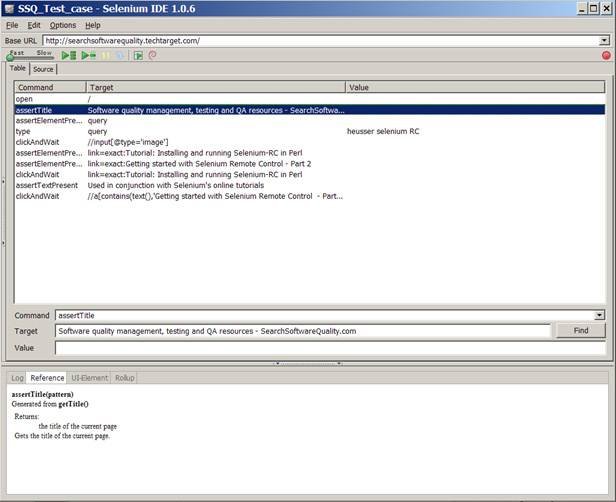
IDE is an acronym for Integrated Development Environment. Using Selenium IDE, instead of having a program over here talking to a remote controller over here that drives a browser in a third place, the entire application runs inside the web browser. To do that, Selenium IDE was built as a browser plug-in for FireFox. Let's take a look at the software in-action, after I have recorded a simple script:
This will all be explained in more detail below, but I wanted to give you a quick look at what your Selenium RC screen will look like when we're through. To record this, all I did was start Selenium IDE, type http://techtarget.searchsoftwarequality.com (enter), and use the site to search for my tutorial on Selenium RC. With the test recorded, I can replay that test by clicking the green go button. The 'Base URL' for the test is SearchSoftwareQuality.com so we don't see that mentioned in the open method, but above in the Base URL field. With Web testing, often it can be tricky to obtain an element's id. However, Selenium is able to capture the ids in the target field as the tool is recording actions taking place in the Firefox browser.
One thing the test doesn't do (yet) is actually confirm any text on the screen -- it drives the browser, but doesn't inspect it. We'll talk about that later.
Before we can do that, let's talk about how to install Selenium. Then I'll cover more on how to use it effectively, and a little bit on how to save, re-use tests, and make test suites with the tool.
Installing Selenium IDE
We'll start by going to the openQA download page, which you can find at http://seleniumhq.org/download and clicking on the link to download Selenium IDE. That will take us to the Selenium IDE Add-On Installer:


Now click the "Install Now" button to get started, followed by "Restart FireFox."
You should see a note that the new Add-on was installed, and that's it. You can start Selenium IDE by clicking Tools->Selenium IDE from your Firefox browser.
It's that simple.
Now let's walk through creating that first test together in more detail; you may want to print this page out and follow along.
Recording an Effective Test

  1. Open the IDE through Tools->Selenium IDE.
  2. When the window pops up, mouse over the red button on the top right. It should say "Now recording." If not, click the button to start recording.
  3. In your browser, go to www.searchsoftwarequality.com.
  4. Look at the title of the web page; the words in the blue bar at the very top-left of the screen.
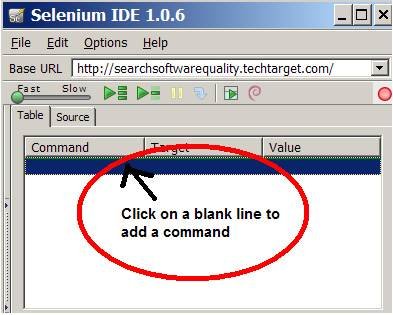
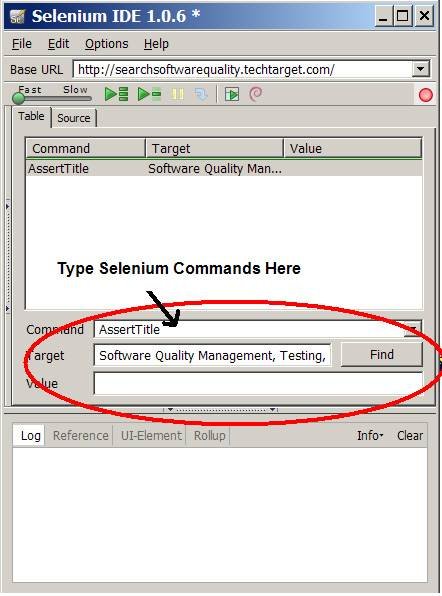
  5. Let's assert that title comes up when we start testing. So click on the white box to add a command:


  • 1.)Then click on the Command textbox and type in "assertTitle" into the command window and "Software quality management, testing and QA resources - SearchSoftwareQuality.com" (which should be showing in the Firefox Title Bar) into the Target textbox.


    2.)Now go back to the browser, click on the search textbox. Type in "Heusser Selenium RC" and click search.
    3.)This brings us to a search results page. In steps 9 and 10, we'll add in checks for two recent Selenium articles that I wrote. 
    4.)
    Click on the next blank command line in the Command Table. This is necessary in order to add a new command. Add an assertElementPresent command for "link=Tutorial: Installing and running Selenium-RC in Perl"
    5.)Add a second assertElementPresent command for "link=Getting started with Selenium Remote Control - Part 2."
    6.)Go back to the main browser window and click that first link to go to "Tutorial: Installing and running Selenium-RC in Perl." The action of clicking the link will both take us to that actual page, and "record" the event in Selenium IDE, adding it automatically to the test case.
    Now we're on a browser page for the first tutorial. Let's make sure at least some actual text from the article appears. To do that: 

    7.)
    In the Selenium IDE window, click on the next blank command line. Then enter the command "assertTextPresent" and add "Used in conjunction with Selenium's online tutorials" added to the Target text box.
  • If you followed these directions, click the red button to stop recording, and you should have something like this:

    The slash at the top is actually a command to open the 'Base URL,' which we can see at the very top is our website. This is a sort of shorthand, so that we can skip the http colon slash slash domain-name dance for every open command. Without the full path, Selenium assumes it is part of the Base URL. In our example, we typed in SearchSoftwareQuality.com and hit enter, causing that Base URL to be set.

    Now that the test is recorded, you can either click one of the green play buttons (we only have one test right now; the test is the suite) or click at the top of the command list and click the step in button to run one test at a time. If you get errors, it's likely that you called assertElementPresent when it should have been assertTextPresent, or you made a typo in the check or command. You can compare your test to this one to look for differences.
    In addition to checking for text and links, Selenium has a host of commands. Most of them, such as clicks, checks, and selects, can be recorded automatically with the IDE. One popular command is waitForElementPresent (element_name) which can be especially important when waiting for Javascript elements to populate. The commands are extensive; this list of common Selenium commands should get you started.
    Also, if you end at a different place than you start, make sure you begin with an "open" command with a location of "/" and that the base URL is the place to start. If the test misses this for some reason, just add the command at the bottom and drag it to the top.
    Saving Tests, creating and re-suing suites
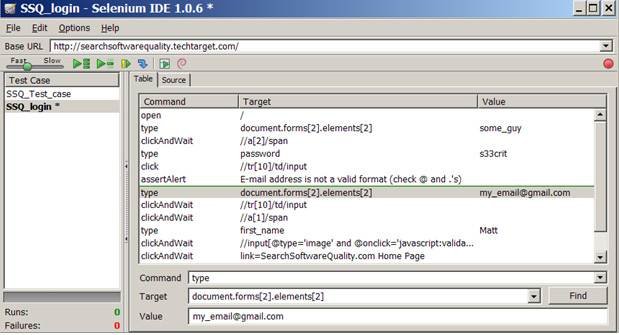
    Sooner or later, you'll want to close your browser, and you'll likely want to get your file back next time you open it. From Selenium IDE use the File Menu to Save Test Case As and specify a filename. This will save to your hard drive for next time. Another option is to create a New Test Case and save that. Having more than one test case open at once shows us the test suite interface. This is just like the test case interface, except it shows the name of all the test cases loaded at left:

    We can now run our tests collectively and save them as a suite. While for smaller apps you may be able to test the entire application in one suite, you'll likely want to break them up for larger applications. In that case, I suggest a test for each minor feature and a suite for each major feature, with each suite saved in a directory. That way, you can test major pieces one at a time. With multiple testers, you can put the entire system under version control, just like software code, and have multiple people working on tests at the same time.
    This is just a quick introduction, but you can find a great deal of detail in the Selenium IDE documentation on-line. I've tried to hit the highlights and get you started quickly. Now I could end the tutorial and ride off into the sunset, but if you'll allow me, I've got a little bit more advice to give.
    Beyond Selenium IDE

    Once the thrill runs off of working with the IDE, you're faced with a few realities. The tool generally takes up your whole browser, and while it is faster, it really isn't that much faster than testing by hand. It always does the same thing, over and over again, and it doesn't have any of the features we look for in a programming language such as variables, looping and abstraction. So if you've got a technical team interested in doing some serious automation testing, I generally suggest moving from Selenium IDE to Selenium Remote Control, which can be programmed. If that tickles your fancy, read the two Selenium RC tutorials that we searched for in our test case. You have the basics. Now it's time to move to the next level.