Showing posts with label J2EE. Show all posts

Wednesday, June 13, 2012

Struts 2 Interview Questions

1) How to create an action with Struts2?
 Creating an action in Struts2 is very different from Struts1 in the sense that there is no mandatory requirement to extend a class from the struts library. A Java bean/POJO which has the private member variables and public getters and setters is sufficient to become a struts action class. As far as execute() method of Struts1 is concerned, a method with return type of String is sufficient. The method name is to be specified in the struts.xml. This change is done so that the testing of struts based application can be done easily.

2) In struts.xml, what does the attribute "method" stands for in the "action" tag?
The method attribute tells the name of method to be invoked after setting the properties of the action class. This attribute can either hold the actual name of the method or the index of the result mapping.
For example:
<action class="com.company.app.Login" method="login" name="login">
    <result name="success">/success.jsp</result>
</action>
<action class="com.company.app.Login" method="{1}" name="login">
    <result name="login">/success.jsp</result>
</action>
In both the examples, the method being invoked by Struts will be login with the signature as 
public String login()


3) If I have an ArrayList of say Employees class in the struts action (which may be fetched from the database), how can I iterate and display the Employee Id and Employee Name on the next JSP being shown? Assume the name of ArrayList to be employee
We can iterate such a collection as:

<s:iterator value="employee">
       <s:property value="name"></s:property>
      <s:property value="id"></s:property>
</s:iterator>

4) What is the advantage of having a POJO class as an action?
As mentioned in the first question, the POJO class is light weight and easy to test with frameworks like Junit. Moreover, there is no need to create separate ActionForms to hold the values from the source web page.

5) What is the advantage of extending the action class from ActionSupport class?
The use of ActionSupport class provides the features like validation, locale support and serialization to an action,

6) How can we get rid of .action at the end of URL's in struts 2?
You can get the answer to that question from one my other blog post at:

7) How can one integrate Spring IoC with Struts 2?
Struts 2 comes with support for Spring and Spring can be used to inject beans to various classes. It can also be used to inject properties to the action class of struts 2. For configuring Spring, contextLoaderListener can be configured.

8) Describe the flow of a request in a Struts 2 web application?
 It can be best understood by using a diagram. Please refer the following URL for understanding the same.

9) What tool/IDE/frameworks do you use to write code in a Struts 2 web application?
Mostly it is MyEclipse 9 which has excellent support for struts 2. Netbeans 7  has support for Struts 1 but not Struts 2. Other that the IDE one can also mention tools like DreamWeaver, Spring, Hibernate, XMLSpy etc.

10) What are the steps to migrate a web application written with Struts 1 to Struts 2?
This involves moving ActionForms of Struts1 to POJO properties of Struts 2.
Converting Struts1 struts-config.xml to struts.xml of Struts2. 
Rewriting the Struts action classes for Struts 2.


Friday, March 2, 2012

Performance monitoring tools optimize Java applications

Sun’s JConsole monitoring tool is included with the Java Developers Kit 5.0. It leverages the Java virtual machine’s comprehensive instrumentation to deliver real-time information on resource utilization and consumption and total application performance. JConsole accesses core functionality for monitoring and managing the Java platform including:
  • Memory status – detection of low memory
  • Manages verbose tracing of GC and class loading (enable/disable)
  • Detection of programming deadlocks
  • Control of any loggers running in the application
  • Access Sun's platform extension to manage operating system resources
  • Manage Java Beans  
VisualVM runs on Oracle and Sun JDK 6 to monitor Java applications and troubleshoot performance issues. It utilizes available Java technologies, including jvmstat, Serviceability Agent (SA), and JMX, to automatically gather data using the most efficient method possible so that the least amount of system overhead is imposed on the application. Its default features meet the needs of system developers and administrators, and enables application users to submit comprehensive bug reports. The tool is useful for production and development phases and expands the Java platform’s capability to monitor and analyze performance.
Hewlett Packards’ HPjconfig is a tool for configuring Java kernel parameters to meet your application’s requirements when under HP-UX 11i on the HP 9000 PA-RISC system and other compatible systems. HPjconfig recommends kernel parameters and provides save and restore functions to enable distribution of those recommendations to application users. Informed of the exact Java and HP-UX versions to be analyzed, HPjconfig will confirm that the latest patches are installed to ensure maximum performance. Any missing or superseded patches are highlighted for easy identification and resolution.

HeapAnalyzer from IBM detects Java heap leaks using heuristic search analysis of the heap dump in the application. HeapAnalyzer parses the Java heap dump to produce directional graphs then transforms those into directional trees.
An open source tool, GCViewer, lets developers visualize data from verbose garbage collection on Sun and IBM virtual Java machines. You can maximize the performance of your garbage collector using metrics provided by GCViewers, including throughput, longest pause, accumulated pauses and others. Better garbage collection will increase application performance as well.

Java Out-of-Box Tool installs startup scripts that configure system tuning parameters to deliver better “out-of-box” performance. Upon installation, the software modifies kernel parameters, rebuilds the kernel, and then executes a system reboot.

Practical challenges of profiler integration with Java/J2EE applications

Profiling is a technique used to identify code-level performance bottlenecks in an application and tune application code accordingly. In the context of Web-based and multi-tiered applications, the profiling needs to be done in the Application Server/Middleware tier as most of the business logic processing is centered there. The focus of this paper is to briefly describe the components and process of profiling; share some practical challenges of integrating profiling tools with Java applications specifically; and suggest some options to overcome these issues so that profiling and tuning activities can be carried out effectively. 
Introduction
The term “Profiling” refers to understanding and analyzing an application's programs in terms of the time spent in various methods, calls and/or sub-routines and the memory usage of the code. This technique is used to find the expensive methods/calls/subroutines of a given application program and tweak them for performance optimization and tuning. Alternately, the amount of time it takes the code to run is also referred to as “Latency.” In typical multi-tiered applications; especially on the server side, it is called “Server-Side Latency”.
Profiling can also be used to get insights on the application in terms of memory usage -- such as how the objects/variables are created in memory provided by the runtime (JVM Heap, .NET CLR, Native Memory, or others) -- which can be further used to optimize the memory footprint of the applications. Also, for multi threaded applications, profiling can uncover issues related to Thread Synchronization and show the thread status as well.
The objective of this article is to enumerate some of the most common practical challenges in integrating Profiling Tools with Java/J2EE Applications (standalone or Application Server-based) and discuss workarounds that can help significantly reduce turnaround time required for profiling integration activity in the Application Performance Management process.
For instance, in a 3-tiered Web application comprised of a WebServer, Application Server and a Database server, let us consider an online business use case or business transaction that is taking more time to respond to an end user who is accessing it through a browser. In this context, the high end-to-end response time of the transaction could be attributed to Client Side Rendering, Web Server Request/Response handling, or Business Logic Processing on the Application Server or Query Execution on the Database Server. In order to find out the tier where the latency is high, profiling can be used to uncover where the server-side time is being spent.
types of profiling
Profiling can be broadly categorized into 2 types - CPU profiling and Memory Profiling.
CPU Profiling
CPU Profiling mainly focuses on identifying the high latency methods of the application code in Java context – it will provide the call graph for a given business process with the break-up of time spent in each of the methods. The method latency can be measured in 2 ways – Elapsed Time and CPU Time.
Elapsed Time is the time taken by a method. This includes the time taken within the method, its sub-methods and any time spent in Network I/O or Disk I/O. Ideally, the elapsed time is the duration between the entry and the exit of a method as measured by a wall clock. For instance, if a method involves the execution of business logic in Java code and SQL calls to a database (which is Network I/O), elapsed time shows the total time for all of that method to run.
Elapsed Time = CPU Time + DISK I/O + Network I/O 
CPU Time refers to the time taken by a method/function/routine spent exclusively on the CPU in executing the logic. Hence, it does not include the time taken for any I/O or any other delays from the Network or Disk I/O. For the same example mentioned above, CPU time does not show the time spent in database execution because that is Network I/O.
CPU Time = Time exclusively spent on CPU
(without I/O or any Interrupts Delay)
In general, it is the Elapsed Time which will be of interest; however, both halves provide quite valuable information about the application processing.
If the CPU time is very high for a given method/routine/function, it indicates that the method/routine/function is processing intensive and little I/O is involved for that method/routine/function.
Alternately, if the Elapsed Time is very high and CPU Time is less for a given method/routine/function , it indicates that the method/routine/function has significant I/O activity.
In extreme cases, the CPU time and the wall clock time can differ by a very large factor, especially if the executing thread has a low priority – since OS can interrupt the method execution multiple times due to low thread priority.
Memory profiling
Memory profiling refers to analyzing how the objects are created in memory provided by runtime (such as JVM for Java/J2EE applications and .NET CLR for .NET applications) and thereby to optimize the memory footprint needed for the applications. Memory profiling can also be used to find critical issues such as Memory Leaks in the applications.
generic architecture of profilers
This section provides a generic architecture of a Profiling Tool. Typically, any profiling tool will have 2 major components – an Agent and a Console.
An Agent is also sometimes called a Probe or Profiler which is a component that will run on a server (typically an Application Server) where the code is deployed and running. The agent will be attached with the JVM whichcollects performance metrics using JVMPI/JVMTI interfaces and push the data to a pre-configured port on the host machine where the application is running.
A Console is a Java program which typically captures data from the pre-configured port and displays the metrics in dashboard view. This will be used to view the metrics and also capture Snapshots that can be used for offline analysis. The diagram below illustrates the profiler’s architecture in general.

https://lh3.googleusercontent.com/-nRHVsjjWDFI/TqbR1UzH1OI/AAAAAAAAAE8/7Z7-L_BM1zw/s400/profiling01.jpg
Figure. 1. Generic Architecture & Componets of Java Profilers
Process steps in profiling
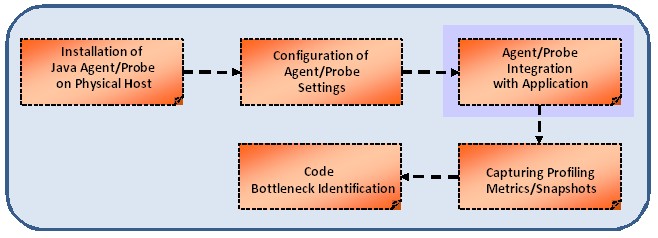
In the context of Java Profilers that need to be used with Java Application Servers/Java Standalone Programs, the Java Agent needs to be attached with the JVM so it can profile the application. This process is referred to as “Agent Integration” or “Profiler Integration”. This will be done by adding specific arguments to JVM in the Application Server’s startup scripts when invoking the standalone Java program.
https://lh6.googleusercontent.com/-bz1ME3Nm31Y/TqbR1kqVFdI/AAAAAAAAAFA/5pECSUSvbH0/s400/profiling02.jpg
Figure. 2. Process Steps in Profiling Activity
The sections below are focused towards Profiling Applications running in Java based Application Servers.
practical challenges in profilers integration & remediation
In this section, I would like to present the practical challenges of integrating Java Profiling Agents with Java/J2EE Applications and Java Application Servers and suggest ways and means to overcome the issue so that profiling activity can be carried out effectively. These issues are broadly divided into several categories as illustrated in Fig.3. below. The various categories and remedies are discussed in detail in the coming sections.
https://lh4.googleusercontent.com/-MGr27MDDozk/TqbR1tc7W5I/AAAAAAAAAFM/Fb_WbANo9M4/s400/profiling03.jpg
Figure. 3. Profiling Integration Issues

–XX Debugging/diagnostic Java parameters
Issue
Integration of Java profilers with Java based Application Servers might not be stable or successful if the JVM arguments contain the –XX arguments, especially some of the “Debugging” or “Diagnostic” flags. It should be understood that JVM options that are specified with -XX are not stable and are not recommended for casual use. Also, these options are subject to change without notice.
Hence, an attempt is made here to list some specific –XX flags to look out for while integrating Profilers with Java Application Servers if any unexpected behavior is observed with Profiler Agents.

Recommended Solution
JVM –XX Flag
Description
Impact
Suggestion
-XX:+AggressiveOpts
This flag turns on “point performance optimizations” that are expected to be ON by default in SUN JDK releases 1.5 and above. This flag is to try the JVM's latest performance tweaks, however a word of caution is that this option is experimental and the specific optimizations enabled by this option can change from release to release which should be evaluated prior to deploying the application to Production.
(NOTE: this should be used with -XX:+UnlockDiagnosticVMOptions & -XX:-EliminteZeroing)
JVM might not start up with a Java Agent / Probe
AND/OR
Application might crash


Disable these options
OR
Remove these switches from JVM Arguments list in order to enable the profiling activity
-XX:-EliminateZeroing
This option disables the initialization of newly created character array objects. Typically this will be used along with -XX:+UnlockDiagnosticVMOptions
If -XX:+AggressiveOpts is to be used
JVM might not start up with a Java Agent / Probe
AND/OR
Application might crash
-XX:+UnlockDiagnosticVMOptions

Any “diagnostic” flag of JVM/Java must be preceded by this flag.
JVM might not start up with a Java Agent / Probe
AND/OR
Application might crash
-XX:-ExtendedDTraceProbes
Enables performance-impacting “dtrace” probes – the probes that can be used to monitor JVM internal state and activities as well as the Java application that is running (Introduced in JDK 1.6. and Relevant to Solaris OS 10 above only)
If this option is already enabled, adding another Profiling Agent will make the JVM behavior unknown.

-Xrunhprof[:options] 
HPROF is actually a JVM native agent library which is dynamically loaded through a command line option, at JVM startup if the switch is passed to JVM arguments, and becomes part of the JVM process. By supplying HPROF options at startup, users can request various types of heap and/or cpu profiling features from HPROF.
If this option is already enabled, adding another Profiling Agent will make the JVM behavior unknown.

Non-tuned application
Issue
In certain scenarios, where the Application is not performance tuned or the business scenarios have high response time, attaching a profiler to some Applications (Application Servers) will cause time-outs and the Application Server sometimes could not even startup. This is attributed to the additional overhead profiling tools create due to byte-code instrumentation and the overhead linearly increases with the methods’ execution time causing the overall business scenario execution time to be even higher, resulting in time-outs.
Recommended Solution
The recommendation suggested for such scenarios is to identify the high latency code components “by introducing Java code in the application in order to capture the time taken in the crucial methods”. However, this approach has the disadvantage of choosing the critical/crucial classes and methods involved in a business transaction and instrument the logging statements which needs code change, code deployment. 
The following is a code snippet that illustrates this concept:


Class A {
                private long startTime, endTime;
                public Obj obj1;
                public Obj obj2;
                void public method1(){
                                startTime = System.currentTimemillis();
                                ……….
                                ………..
                                ………
                                endTime = System.currentTimemillis();
<logUtility>.log(“Time Spent in method” + this.getClass().getcurrentMethod()+ “in msec:” + (endTime-startTime); 
//assuming the log utility being used for this as well
}

Security privileges
This section highlights the typical security or access privileges issues encountered while integrating Java profiler agents with Java Applications. The table below lists the issues and recommendations to overcome them.

Issue
Issue Description
Suggestion
Owner permissions for Agent Installation Folder
If the Agent/Probe installation folder is not owned by the user with which the Java process gets executed/started, the Probe/Agent libraries cannot be loaded by the Java Process due to insufficient security privileges.

The agent installation folder on the file system should have “owner permissions” similar to that of the “Java Process” recursively
For instance, if the Java process gets started by “wasadmin” user group, the agent installation folder and all its sub-directories/folder should have “wasdamin” as the owner.

(NOTE: On UNIX based platforms, Primary UserId and Primary Group should be the same as that of the Java process)

E.g.:
chown –R <uid:Primary Group> <Agent Installation Folder> - UNIX based Platforms
Execute Permissions for Agent Installation Folder
If the Agent Folder just has only Read and Write permissions, the Agent/probe libraries cannot be executed within Java process.
Assign proper access permissions to the Probe Installation folder recursively

E.g.: chmod 775 <Probe Installation Directory> - (UNIX/LINUX/SOLARIS/AIX/HP-UX platforms)
Read/Write/Execute permissions - WINDOWS platform
Java Applications /Application Servers enabled with Java Security 
For  Java Applications that are enabled with Java Security, profilers might not start due to missing directives in server.policy file.

Grant all security permissions to Agent/Probe’s jar file by adding the  following directives to server.policy file as below.
E.g.: When integrating HP Diagnostics Java Probe with WAS 6.1, profiler could not start and get all the required metrics. The following is added to server.policy file:
grant codeBase "file:/opt/MercuryDiagnostics/JavaAgent/DiagnosticsAgent/lib/../lib/probe.jar" { permission java.security.AllPermission; };

(NOTE: For Java Security enabled standalone applications, identify the property file in which the required security directive needs to be added)

Application Caching
Issue
For certain applications, where Caching is used (either Custom Caching or Distributed Cache Products) to improve application’s performance, profilers might not work as expected. This is attributed to the increased overhead of tracking and probing each and every object available in the Cache.
As some of the Profilers/Probes will have default instrumentation points for different layers like JSP/Servlet, EJB, DAO and standard Java Frameworks like Struts, Spring and ORM tools like Hibernate, even without adding any custom instrumentation points, the overhead will be very high if the Application under consideration uses huge object Caches.
Recommended Solution
In such scenarios, it is suggested to follow one of the options highlighted below:
Disable all the default instrumentation points that come along with Probe/Profiler and observe the application behavior in the context of Profiler.
Disable Caching only while profiling the application to find out any bottlenecks in the Java code and other layers such as the Database or external systems.
Alternately, Reduce the Cache Size so that impact of object tracking and probing can be reduced (this works in most cases since it is desirable to design any Cache that can be configurable in terms of its Size and Cache Invalidation Policies).

Default instrumentation of COTS products running in J2EE Servers
Issue
If the application that needs to be profiled has some COTS products that run in JVM process area, JVM might not startup when invoked with a profiling agent.
I would like to share my experience with one of the industry-leading Rules Engine product that is hosted in a WebSphere Application Server instance which could not be started successfully after integrating a java profiler. With the profiler, the application server used to crash showing an issue in Java CompilerThread in libjvm.so which is a JVM library. There is no sign of any error coming from Profiler’s libraries. Without the profiler, no JVM crash is observed at any time.
Recommended Solution
Ensure that the COTS product running in Java process does not have any probing or monitoring mechanism enabled by DEFAULT. If enabled, try to disable and run with the profiler.
Check if the COTS product is compatible with the profiler in use – Many a times, it’s quite difficult to get any documentation which can confirm the product’s compatibility with the Profiler. Hence, it is suggested to reach out to the tool vendor or COTS vendor to get required support.

operating system specific
Issue
In certain cases, the number of file descriptors set in UNIX based (especially on UNIX/SOLARIS/LINUX/HP-UX) Operating Systems will have impact on the profiling process.
Since profiling activity will load more libraries and binaries, application servers in the context of Probe/Profiler might not start up properly with less number of file descriptors
Recommended Solution
It is recommended to check current file descriptors limit (using ulimit –n) and increase the number of file descriptors allowed on the system higher. It should be noted that this is not a mandatory change required whenever profiler is to be used with an application, however, it acts as one of the checklist items in case of unexpected errors while working with profiler-attached applications.

Best Practices for Risk-Free Deployment

Overview

The cost impact to a company of a failed project can be severe indeed. The impact on the reputation of the project manager can be disastrous.
Software project management is not easy, and it requires considerable skill to successfully manage the many different risks that conspire to de-rail a project:
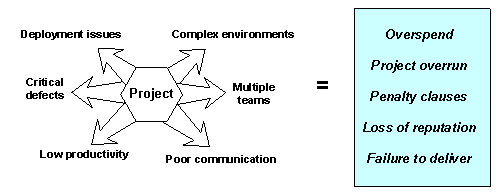
Numerous methodologies are available for mitigating these risks – PRINCE2, RUP, DSDN, eXtreme programming – and these have helped to some extent.
This document introduces the 3D™ methodology – a set of best practices and quality tools developed by BuildMonkey, which can be summarised as.
De-risk. Deploy. Deliver.
In any software project, deployment is a milestone on the project plan that is usually associated with payment – or staged payment. Through the course of development, any number of problems can arise to derail efforts to reach this milestone.
The 3D™ methodology and supporting toolset is based on many years of experience at the sharp end of projects, understanding what has worked and what has not, and the lessons learned from each.
Competent practitioners, and experienced project staff, will find resonance with many of the contents of this document and may find themselves saying “this is just common sense”. This is certainly true, but the main problem with common sense is that it is not as common as people think it is.
This document, and the 3D™ methodology, is an attempt to bring that common sense together in a single location, as a coherent set of best practices supported by proven tools to help you to release on-time, on-budget, with no defects.

The Problem To Be Solved

No methodology has yet focused on the component that all development projects share – the build.
One of the reasons for this is that the term “build” is interpreted differently by different people:
  • The development team sees it as compilation and assembly;
  • The integration team see it as the bringing together of all of the components in the application in a format suitable for release;
  • The deployment team see it as something which produces the artifacts that they have to install and configure;
  • The testing team see it as something which produces the artifacts that they have to test;
  • The Project Manager sees it as an opaque step that nobody is entirely responsible for;;
  • The end customer should not see it at all;
The BuildMonkey view is that the build is the combination of processes and technology that take software from design to deployment – _where the return on investment starts to be seen.
It is clear that a methodology is required to de-risk development projects and to standardise use of the term “Build Management”.
Best Practice: “Build Management” encompasses everything from compilation, all the way through to release to the customer.

No Release, No Revenue

Any Finance Director knows that development is just an activity that needs to be tolerated in order to produce something that will deliver a return on investment.
It may sound strange, but a large number of software developers do not appreciate and embrace this basic truth. This is in part due to their closeness to the application being constructed.
A common problem faced by development projects is therefore that it is the software developers who manage the build. This creates a situation where the build is focused on the needs of development, and is not geared towards releasing the output of coding such that business value can be realised.
Build Management should therefore focus on the end result of development – a return on investment – and ensure that all of the inputs to the process are incorporated in pursuit of this goal:
Best Practice: Focus on the end, and accommodate the inputs

Software Tools Are Only Part of the Answer

Software projects are a complex set of interdependent people and teams and can be likened to a convoy of ships. A convoy has to move at the rate of the slowest ship. Increasing the speed of a single ship in the convoy will not increase the speed of the convoy – it will simply increase the amount of wasted capacity in the speeded-up ship.
Speeding up the slowest ship will, however, have a positive effect since the whole convoy can now move faster.
Many Project Managers try to improve productivity by implementing some degree of automation in development projects – particularly in the area of the build – and often purchase “magic bullet” build software that provides this.
Simply using automated build software does not improve productivity any more than the example above improves convoy speed - as it only increases the speed of a single ship in the convoy.
There is no point in speeding up development, if the target production infrastructure cannot keep pace – this just increases the inefficiency. A lot of organisations make this mistake – highly agile development processes trying to feed into considerably less agile deployment processes. The result is inefficiency, waste and over-run.
Before considering using an automated build tool it is essential to ensure that the inputs to, and outputs from, the build can cope with the improved build speed. It is imperative to ensure that the processes and technology employed are geared towards taking the project to a successful conclusion – on-time and on-budget.
Best Practice: Don’t rely on software tools alone, they may solve symptoms whilst creating problems elsewhere

Configuration Management Best Practices

Software Configuration Management (SCM) is a relatively mature discipline with much written about methodologies and techniques, and these will not be recreated here.
We will focus instead on leveraging the SCM repository, and the facilities that it offers, to further the goals of the project rather than to consider SCM in its own right.

It All Starts Here

The SCM repository - how it is managed and used – is the keystone of good build management and successful delivery of projects.
The SCM repository is the slave of the project, not the other way round. It should be solid and reliable, yet flexible enough to accommodate the needs of new projects. Project Managers should not have to retrofit their planning to accommodate an inflexible SCM setup.
If used correctly, the SCM repository will enhance productivity, and minimize risk, through being able to provide exactly what the project – and project management – require. If used incorrectly, it can cause delay and slippage through having to do things inefficiently further down the chain.
Best Practice: The SCM repository is the slave of the project, not the other way round.

Configuration Management is not Version Control

Most software developers regard the SCM repository as a massive storage area where they simply check versions in and out – a common cause of problems.
Simply checking things into an SCM repository is not Configuration Management any more than karaoke is opera.
A well-maintained SCM repository is so much more than version control, and should provide:
  • The ability to recreate any identified baseline, at any time;
  • Meaningful statistics on what is changing, when and by whom;
  • Management information, such as “how many new defects were introduced by the refactoring of component ‘X’?”
In order to be truly effective in a project, the SCM repository should store all of the artifacts that form part of a baseline or a release.
Source Code Most development projects simply store the code that is being developed and their use of the SCM repository is no more sophisticated than this.
Data Most applications nowadays are not just source code. Take the example of a modern computer game – the vast majority of the code base is made up of artifacts other than code such as audio clips, pictures and movie clips.
Database Structure and Contents Where an application relies on a database this database will have a schema and structure that may change from release to release – this schema must be captured.
There will normally also be seed data for the database which should be considered as part of the baseline.
Application Configuration In a large distributed application, the software being developed will sit atop a number of pieces of software (e.g. application servers, web servers and message queues).
The configuration of these underlying applications have an effect on the quality – or otherwise – of the software being developed and should, therefore, be considered part of the baseline for a release.
Environment Configuration The underlying environment and infrastructure is a key component of the project, particularly in the case of distributed applications.
Such banal considerations as DNS zone files, user account information and system parameters have to be considered as some of the moving parts which affect the application and therefore be placed under configuration control.
This is of particular importance when there is more than one environment involved in the project (e.g. a development environment and a separate test environment) since the question of “are these environments the same?” crops up again and again.
Best Practice: Everything that can be changed, and affect the behaviour of the application, is a candidate for configuration control

The Point of Labelling

It is a common misconception that simply applying labels, or tags, to the SCM repository creates a baseline but this is only partly true without corresponding records of:
  • What label has been applied;
  • When that label has been applied;
  • Why it has been applied (i.e. what milestone, or other external event, the label is associated with);
The use of a naming convention for labels can deceive even further. For example, a project that uses a date-based labeling convention (dd_mm_yyyy) will have several labels of the form (03_05_2004, or 09_06_2004) and will reasonably assume that they have some kind of record of the baseline on those dates.
But what was happening in the project on those dates? Was the 03_05_2004 label applied immediately before a release to test, or immediately after?
Best Practice: Labels should be used to identify and inform about events in the project
Don’t Label If There Is No Point This may seem like stating the obvious, but there should be a reason for a label being applied – the whole purpose of labeling is to identify some event in the development cycle that may need to be re-visited.
To this end, labels can be divided into two categories:
  • Point-in-time
    Associates particular versions with a particular calendar date, or other event that is fixed in time (e.g. MONTH_END_JAN_2004, or RELEASE_1_0_1);
  • Point-in-process
    Associates particular versions with events in the project that may recur at a later stage (e.g. LATEST_RELEASE, or CURRENTLY_IN_UAT);
Best Practice: Every label should have a point, whether point-in-time or point-in-process

Management Information

The job of the Project Manager, ultimately, is to bring the project to a successful conclusion. If this were an easy task that happened by default, then there would be no need for a Project Manager.
In order to be able to do this job well, a Project Manager needs information. He needs to know what is going on in the project – who is doing what, who is working on which components, and a wealth of information can be obtained from a well-managed SCM repository:
  • What is changing in the environment – what has changed since a given point in time or how often particular elements are changing;
  • Who is changing things in the environment;
  • Why things are changing in the environment;
Of course, the final item in the list requires that committers are using descriptive comments to indicate why they are marking a particular change. A well-managed SCM repository should enforce this.
Best Practice: The SCM repository should provide meaningful, and accessible, management information

Build Best Practices

As explained at the beginning of this document, the term “build” means different things to different people. The most common interpretation is the one used by developers, where the term “build” describes the compilation and assembly step of their development activities but this narrow interpretation is a common cause of problems and over-runs, on development projects.

Building is not Compiling

At the outset of the project, the Project Manager will ask the question “how long to set up the build?” and a developer – thinking of compilation and assembly – will answer something like “1 day” – a task and duration which is then duly marked on the project plan and development begins.
Later in the project, when it is time to start deploying and testing the application, this “build” needs to be refactored to accommodate the deployment and test tasks. In doing so, it turns out that the way the application is being assembled is not conducive to it being deployed or tested correctly – so the compilation and assembly staged need to be refactored as well.
In the meantime, the development team sits on its hands whilst the “build” is refactored to accommodate the needs of the project – valuable time is lost whilst the deadline continues to advance.
Best Practice: Know what will be required of the build before starting to write the scripts

Don’t Throw Out The Baby With The Bathwater

From a build perspective, projects with similar architecture (both in terms of the team and the application) will have similar attributes. There will obviously be some changes required, but these will tend to follow the 80/20 rule to a large degree.
For example, a web application that is being developed by an in-house team and that will be deployed to a Tomcat servlet container and Oracle database will follow largely the same steps and require largely the same deployable artifacts.
A good SCM repository will enable the latest versions of boiler-plate build scripts for such an application to be found. These can be used almost off-the-shelf – meaning that development can start apace without having to wait on the build to be constructed for similar applications .
Best Practice: Well-crafted builds are re-usable and should be re-used

The Architecture Drives The Build<

Following on from the previous section, it should be clear that the architecture of what is being developed – and the structure of the team(s) developing it – will dictate how the build should look.
There is little value to be gained in trying to retrofit build scripts for a computer game (developed by 12 people all in the same room) into a project to produce a large J2EE application with development occurring at six different sites around the world.
Best Practice: Well-crafted builds are flexible, but a “one-size-fits-all” approach can be costly

Management Information

There are a number of people who need information that the build can provide:
  • The Project Manager needs to track overall progress against defined milestones – number of outstanding defects, whether a committed release date will be met etc;
  • Development leads need to be sure that the code is of the quality that they require – test reports, bug analysis patterns, code metrics, document and UML generation etc;
  • The deployment team need to know that the artifacts will work in their target environment, and that the environment is as the application expects it to be. They also need to know whether two (or more) environments are “the same”;
  • The test team need to have confidence that they are testing against a known baseline, and whether defects that they see have been rectified in development (or whether they are re-appearing after already being fixed);
  • Everybody needs to be able to communicate effectively using the same language, and have a common terminology for release versions – particularly if there are multiple threads of development;
A good build infrastructure will provide all of the above information, and more besides.
Best Practice: The build should tell all project participants what they need to know

Deployment Best Practices

Considering that it is generally an important milestone on a project plan, normally resulting in payment or a staged payment, deployment is one of the most overlooked areas of software development.
The normal course of events is:
  1. Release artifacts are created;
  2. Some installation and release notes are cobbled together in the form of a README;
  3. The deployment team work frantically to install and configure the application – the testing team (or, worse still, the customer) are idle and unproductive in the meantime;
  4. Some symptoms are found which are suspected to be application defects;
  5. The development team blame the environment;
  6. The deployment team blame the application;
  7. Repeat (5) and (6) ad nauseam.
When a documentation team are also considered - responsible for creating documentation that the end user will need to install, configure and use the application – the situation becomes even more difficult.
This situation can be avoided by planning for deployment from the beginning. Deployment is an inevitable part of software development, yet it always seems to take people by surprise.
Best Practice: Know that deployment is inevitable, and incorporate it into the automated processes

Deployment Is Not Installation

As part of normal development activities, artifacts are installed into sandbox environments – and test environments – many times. But this is not deployment, this is installation.
In order to get an application into its production environment, be that an internal environment or on hosted-infrastructure, a number of hurdles must be overcome:
  • The application must pass UAT;
  • The application must be installed and configured correctly:
  • All pre-requisites for the application must be satisfied;
  • The end customer must accept the handover;
Deployment is that point in the life of an application where it starts to produce a return on investment. “Launch”, “Go-live”, “Release”, “First Customer Shipment” are all phrases which describe the same event.
Best Practice: Deployment is the point where an application starts to provide a return on the development investment.

The Environment Is a Refactorable Component

This point cannot be stressed enough, particularly in large distributed applications.
Every application, large or small, has a runtime environment in which it operates. In a simple desktop application, this is a standalone machine (such as a PC). In larger applications, this will be a combination of machines (e.g. an application server and a database) operating together to provide the runtime environment.
In either case, the application expects certain facilities to be available from the runtime environment and will function incorrectly – or cease to function – if these are not present .
The environment itself, whether standalone or a network, contains many moving parts that can be independently configured. IP addresses, or hostnames, can be changed. User privileges can be modified or revoked. Files and directories can be removed. Each of these can have an effect on the way that the application behaves.
In an environment that is owned and managed internally this can be bad enough. In an environment that is owned and managed by an external third party, and where project success is contingent upon successful UAT in that environment, this can be disastrous.
Best Practice: Be able to identify whether the deployment environment is as prescribed, and “fit for deployment”
Environment Verification Testing One of the most common questions that arises in development projects containing more than one environment is, simply, “are these environments the same?” and its answer can be elusive.
It is essential to be able to answer that question – quickly and accurately – so that any perceived defects in the application can be categorised as “defect” or “environmental”.
This ability becomes particularly poignant where on or more of the environments are owned by different teams, or organisations.
Best Practice: Be able to prescribe what the deployment environment should look like, and have a capability to test it quickly.
Regression Testing The environment, as explained earlier, is a refactorable component. It can be changed, and parts can be moved or deleted. However, unlike application code, changes may need to be made to the environment in response to external events (e.g. hardware failure, or security policies).
Applications, particularly complex ones, use regression tests to ensure that observed behaviour after a change is exactly as it was before the change was made. The same should be true of the environment.
Best Practice: Automated regression tests for the environment that will compare observed behaviour both before and after changes are made.
For example, suppose that a number of operating system patches or service packs are applied to an environment where the application has been, or will be, deployed. How are these tested? Do you wait for users, or testers, to start calling to say that there are problems?
Or do you make sure that you know what problems have been introduced before your users do?
Configuration Management As stated earlier, the SCM repository should be used to store any artifact that can be changed and that may have an effect on the environment.
It may not seem obvious, but some of the most obscure environmental changes can cause an application to fail:
  • Hostname resolution;
  • Non-existent user or group accounts;
  • IP and network connectivity;
  • Existence, or otherwise, of files and directories ;
  • Application or operating system configuration files;
It is essential that these environmental variables be placed under configuration control and able to be identified as part of a baseline.
Best Practice: Environmental artifacts that are not part of the application should be part of the baseline

Automate, Automate, Automate

Every single task that is performed as part of a development project – throughout the entire lifecycle – can be placed into one of two categories:
  1. Tasks which require some form of human judgment;
  2. Tasks which do not;
Tasks which fall into the first category can use some degree of automation, but should stop and wait for human intervention wherever judgment is required.
Tasks in the second category should be automated. There is no value in having expensive resources employed to do mechanical or repetitive tasks that a computer could do more quickly, accurately and consistently.
Best Practice: Automate anything that does not require human judgment
A note of caution - it may be tempting to think that automation will increase productivity on its own, but this is not necessarily the case. Automating an inefficient process will simply magnify its inefficiency – as explained in the section on Software Tools are Only Part of the Answer.
This, and it is worth repeating, is a common error – to assume that automated build software alone will improve productivity.
Best Practice: Do not automate inefficient processes, or you will only maximize the inefficiency

7 Aspects Of Web application to be secured

7 Coding/Design practices to secure your web application
  1. Input Validation:
    1. Prefer to have white list validation instead of black list validation.Idea is to accept input data which belongs to the set of known good values.
    2. Regular Expression can be a good choice for implementing while list validations.For e.g public boolean validatePostCode(String code) { return (code != null && Pattern.matches("/^(((2|8|9)\d{2})|((02|08|09)\d{2})| ([1-9]\d{3}))$/",code)) ? true : false;}
    3. One should always prefer third party while list validatiors. Apache Commons validatior can be a good choice for input validation.
  2. Secure File Upload:
    1. Try to upload files on some dedicated file area instead of directly storing in database or on some location in website tree.
    2. Also apply validation checks for size, mime type and file type.
    3. Java Mime magic library can be a good choice to validate mime type.
    4. Also use to scan uploaded files. You can invoke antivirus CLI via Java Run Time to scan files on the fly.
  3. Output Encoding ( Escaping):
    1. Escape html before inserting data into html elements for e.g. <body> escapeHTML(data) </body> .
    2. Encode following 5 characters into html entities (& to &amp; > to &lt; < to &gt;“ to &qot; ‘ to &#x27; / to &#x2f
    3. Escape java script before putting any data in java script elements for e.g.<script>alert(‘escapeJavaScript(data)’ </script>
    4. Escape URLs e.g < a href="escapeURL(url)" />
    5. Escape XML
    6. You can use a apache commons StringEscapeUtils class to perform all above encodings. There are readymade methods like escapeHtml, escapeJavaScript, escapeXML, escapeURL
  4. Exception Handling: 
    1. Exception stack traces should not be displayed on browser.
    2. Never let any exception leak any sensitive information to user/browser.
    3. Catch each and every exception on the server and translate exception in a relevant error message.
    4. Global exception handler can work for all uncaught errors.
  5. Logging:
    1. What to log: All security related events like login, accessing a URL, changing role, assessing a resource.
    2. What not to log: Any confidential or sensitive information like passwords, user credit card details etc.
  6. Security API:
    1. OWASP Enterprise security API provides all essentials security services.
    2. Spring security can be a good decision for Authentication and Authorizations.
    3. Bouncycastle can be used as light weight cryptography API.
  7. Avoid SQL injection:
    1. Always use prepared statement to support parametrized queries.
    2. Avoid string concatenation or string replacement to form queries.